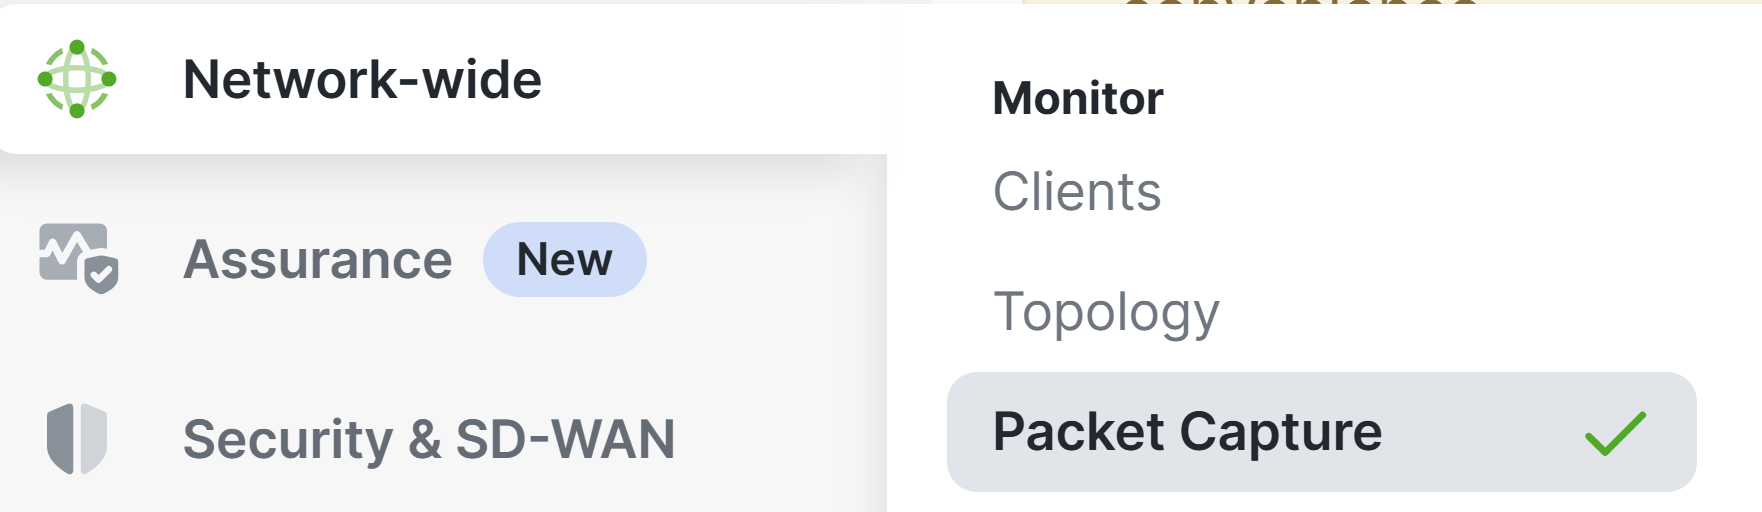
Monitoring Network Wide Packet Capture
Sections:
Resources:
Overview:
- In Cisco Meraki, the monitoring Packet Capture page is a feature that allows admins to capture and analyze network traffic across all devices in the Meraki network
- It provides a powerful live snapshot diagnostic tool for troubleshooting network issues, such as identifying connectivity problems, performance bottlenecks, or security threats
Packet Capture Overview
Packet Capture Page Menu
Packet Captures
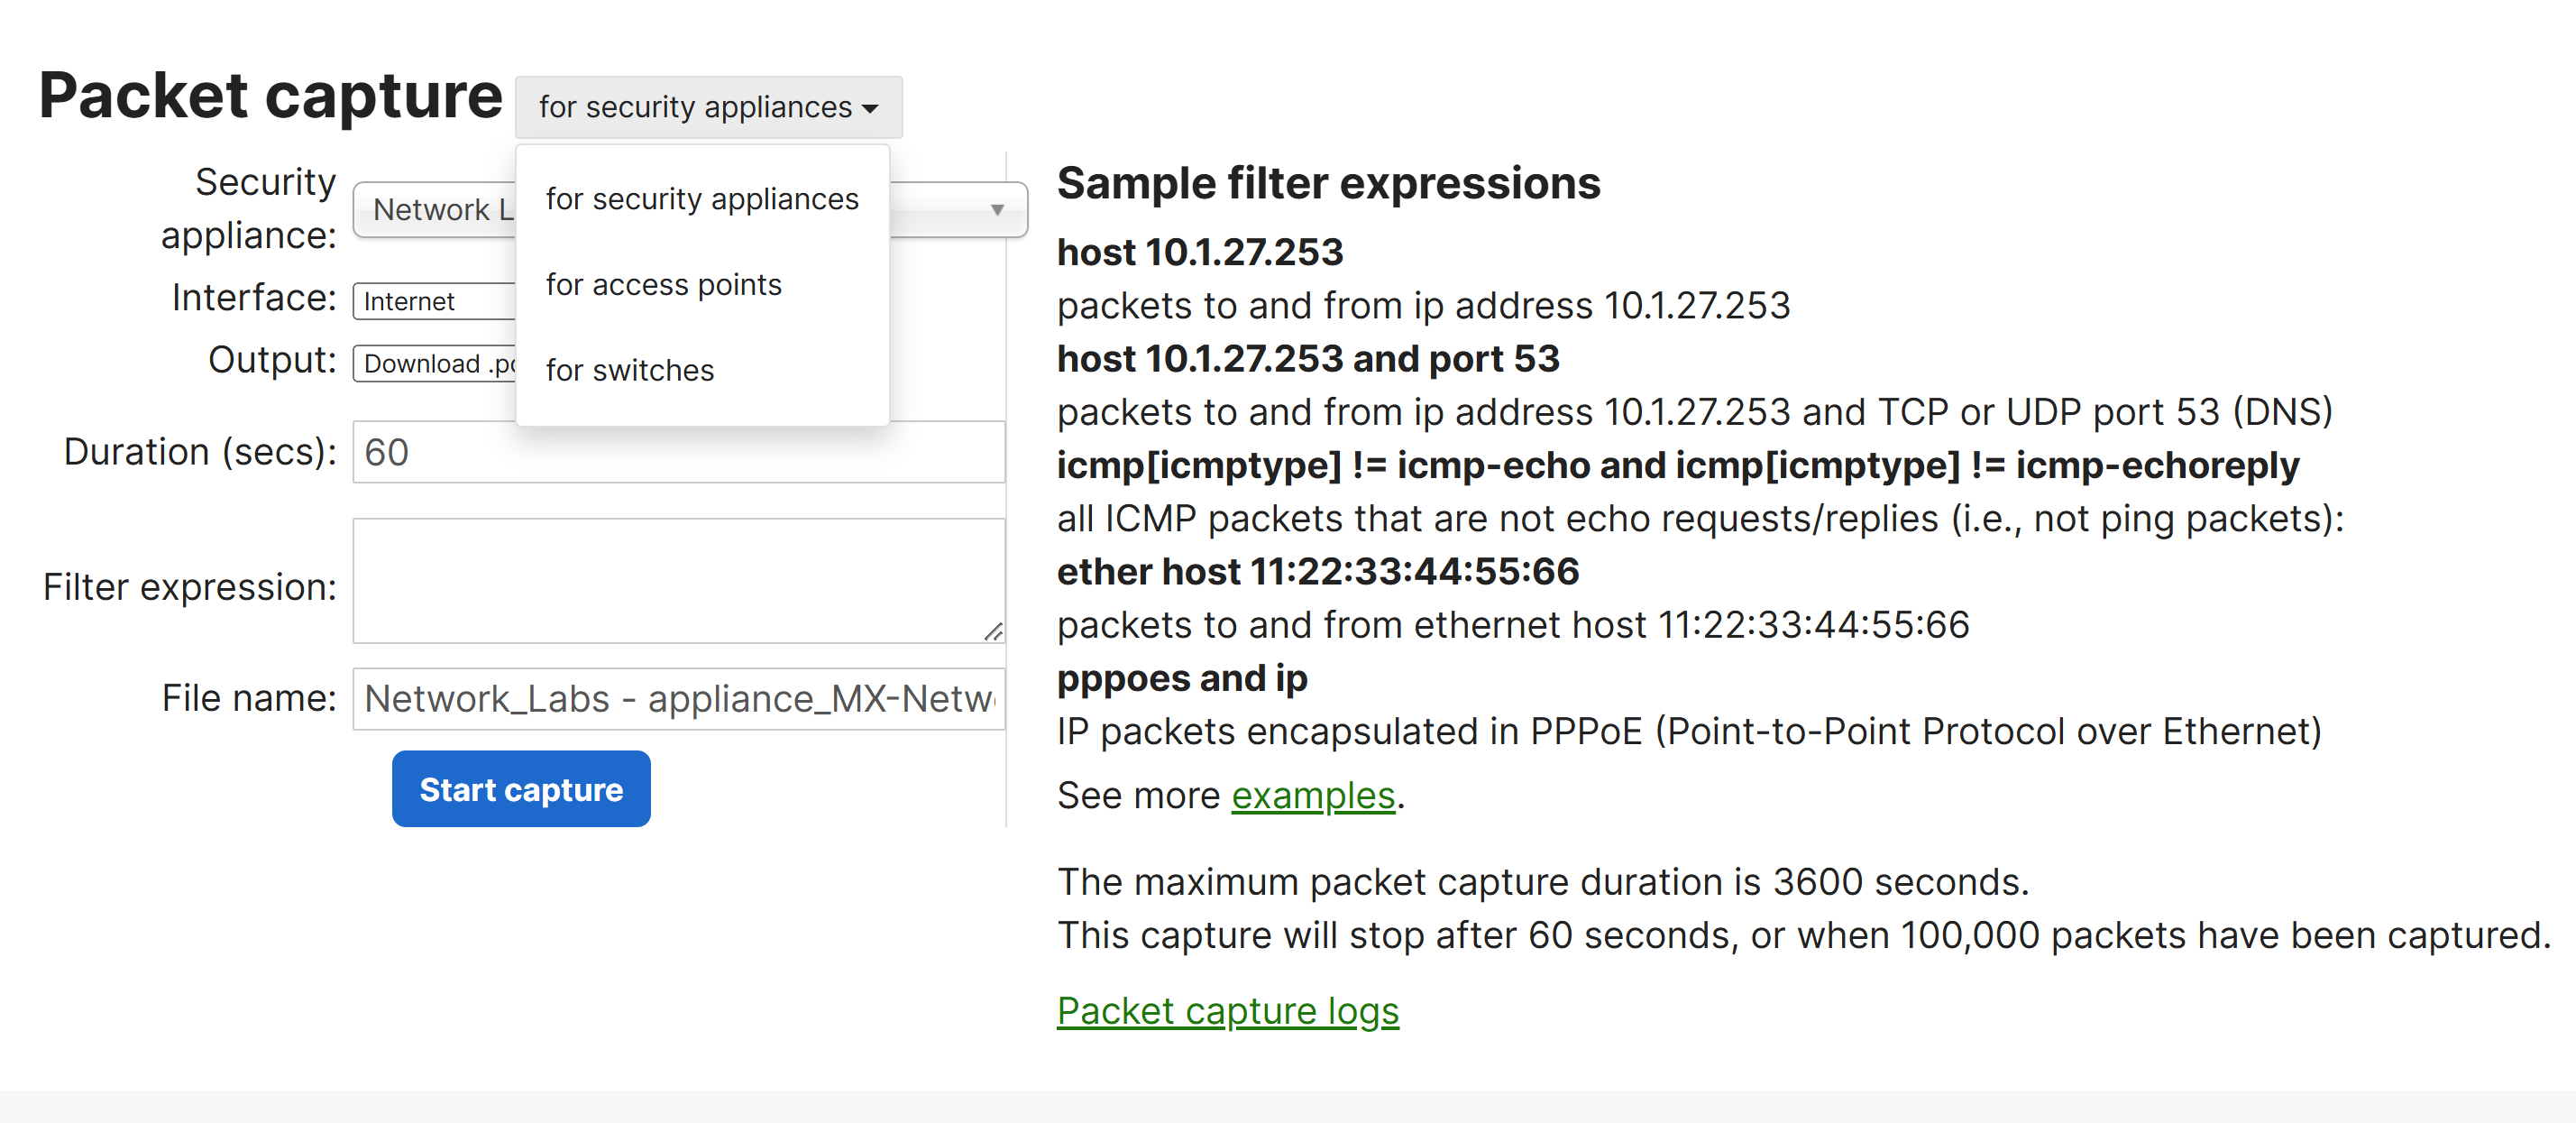
- With Meraki's Packet Capture solution, the packet capture tool is available for various device types including security MX appliances, MS switches, MR access points, etc
Important Cisco Notices
- Per Cisco, once a capture is complete, the data can only be accessed via the output selected. To ensure privacy and security, traditional packet capture data is not stored in the Meraki Cloud
- Per Cisco, only Organization-wide and Network-wide admin accounts with full access can use the packet capture tool. Read-only and Monitor-only network admin accounts are unable to access this tool
Packet Capture Page Overview
Wireshark Packet Capture Software

MS Packet Captures
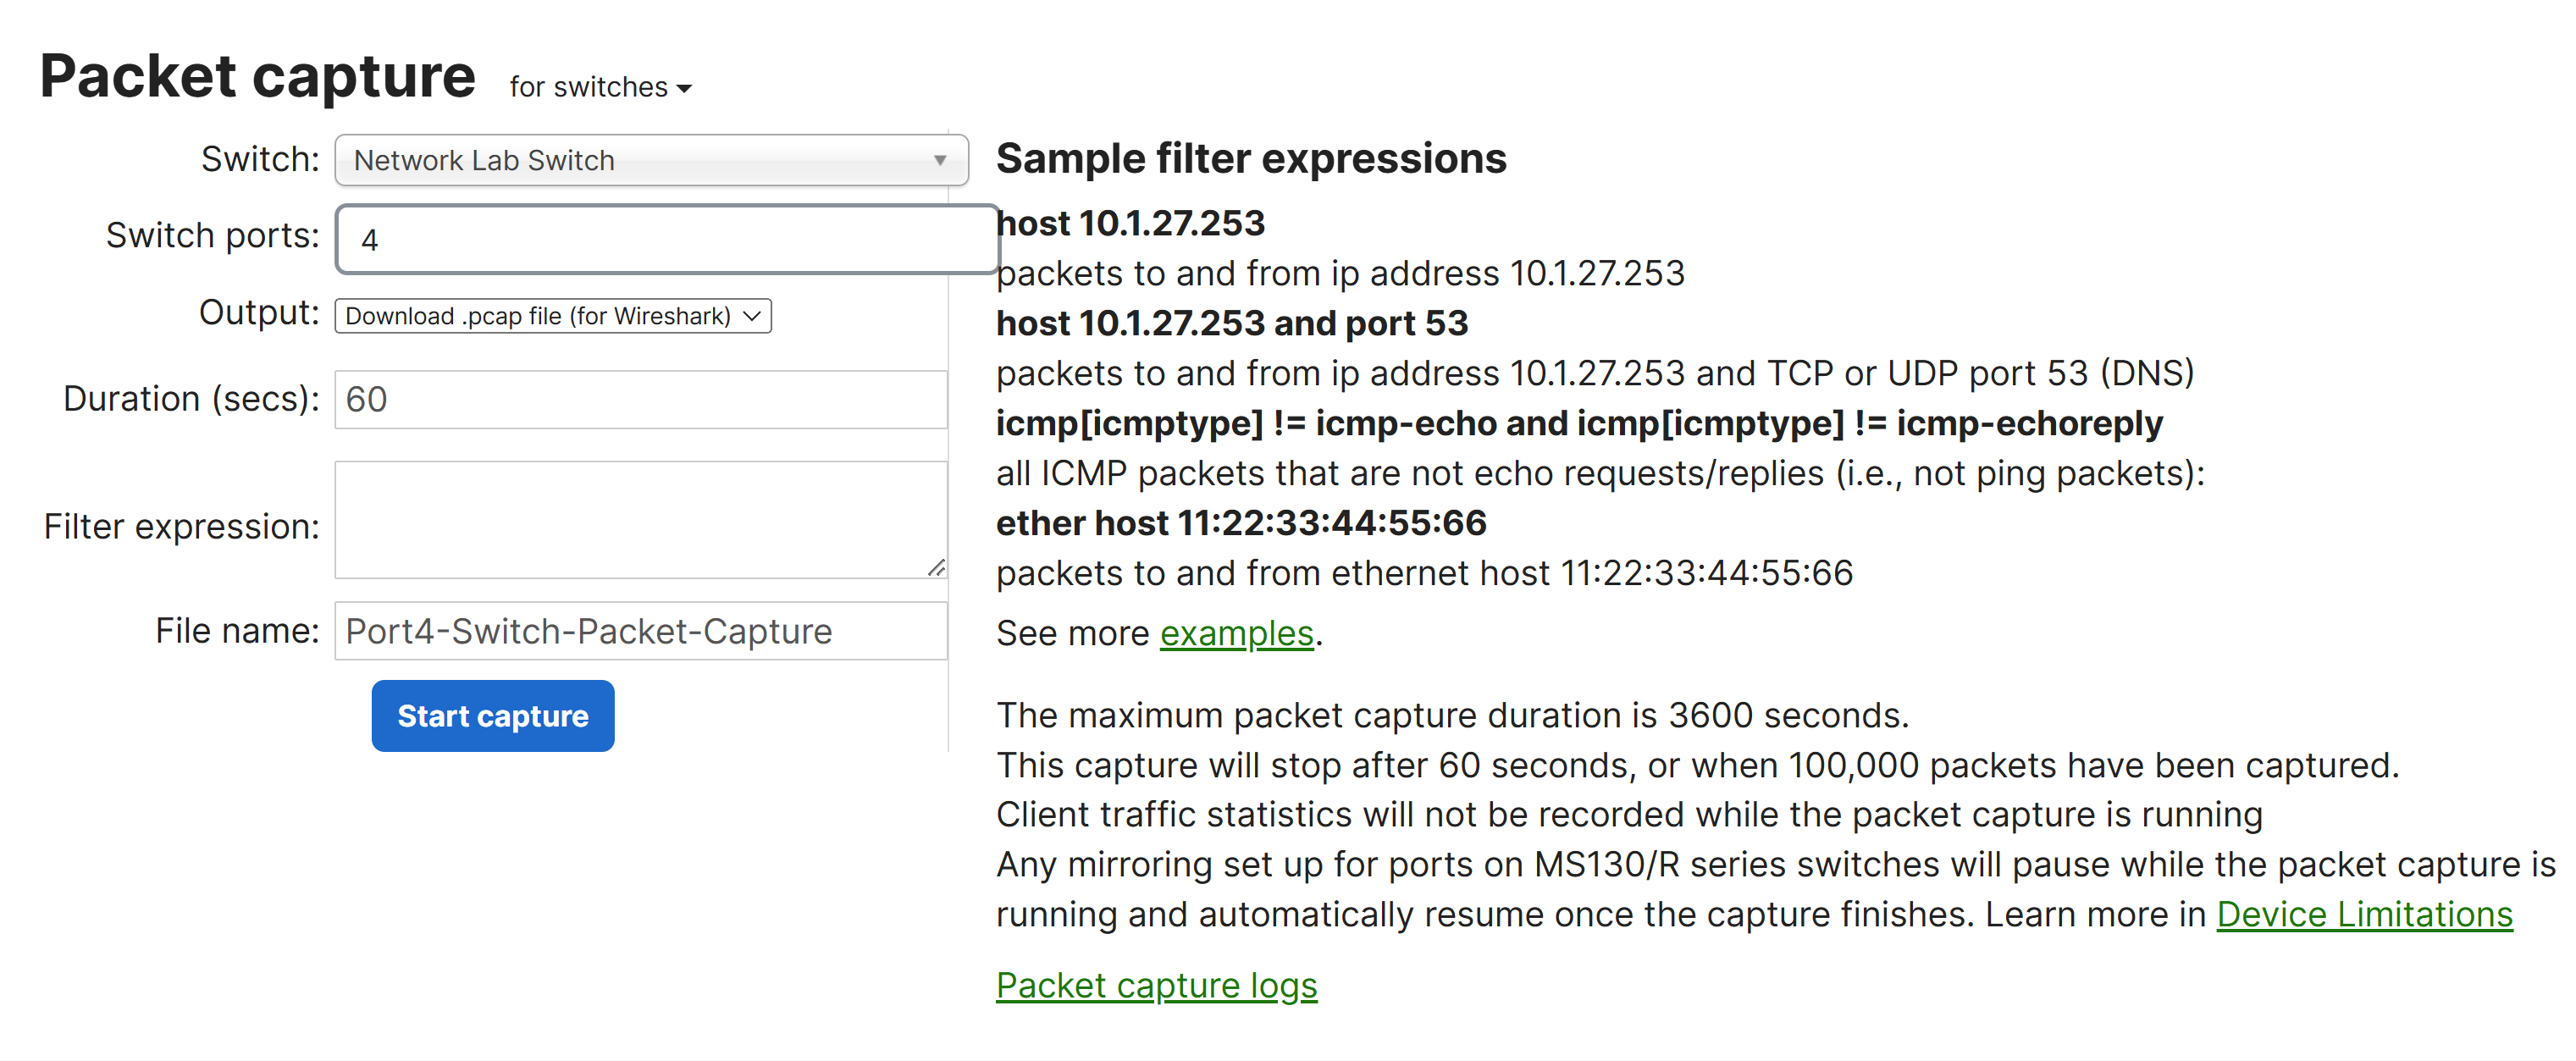
- Per Cisco, MS switches will only let you choose a switch and a port to capture from and is best practice to select the switch and port that the device is plugged into
MS Options
- Switch
- Select the switch to run the capture on
- Switchports
- Select the port(s) to run the capture on
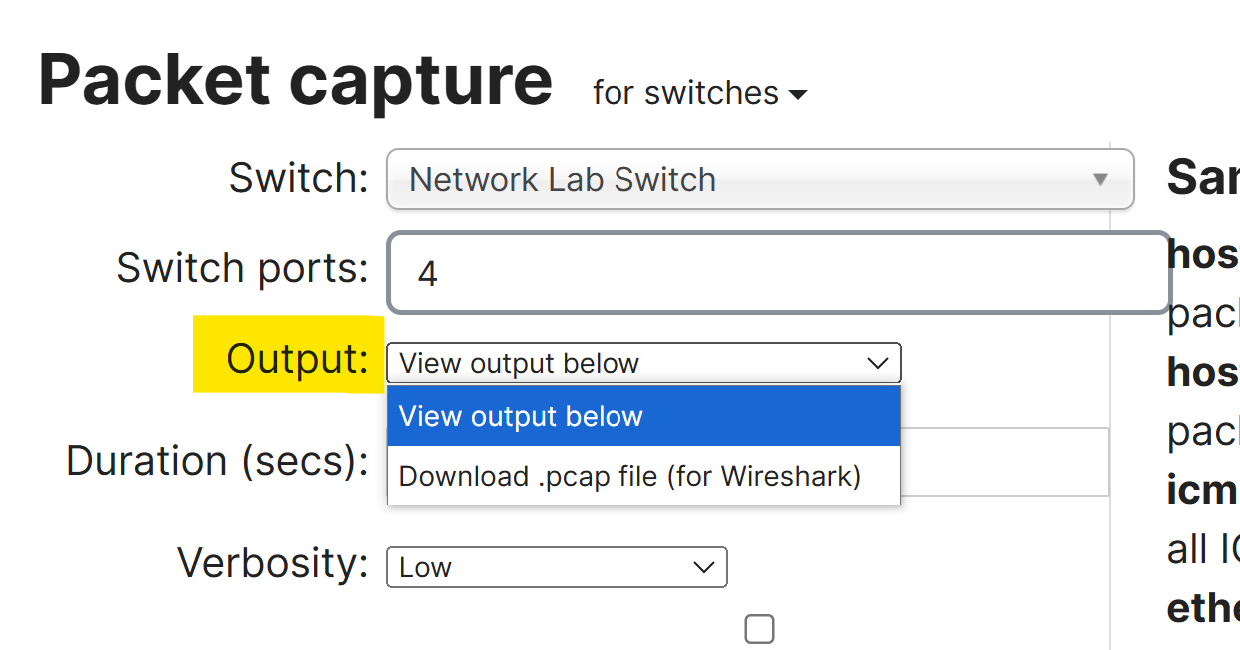
- Output
- Select how the capture should be displayed; view output below or download .pcap
- Verbosity
- Select the level of the packet capture (when using Output; 'view output below')
- Duration
- Define the duration of the Packet Capture
- Filter Expressions
- Apply a capture filter
- File Name
- Apply a packet capture filename
Switch Packet Capture - Method 1: Packet Capture Section
Switch Packet Capture - Output Options
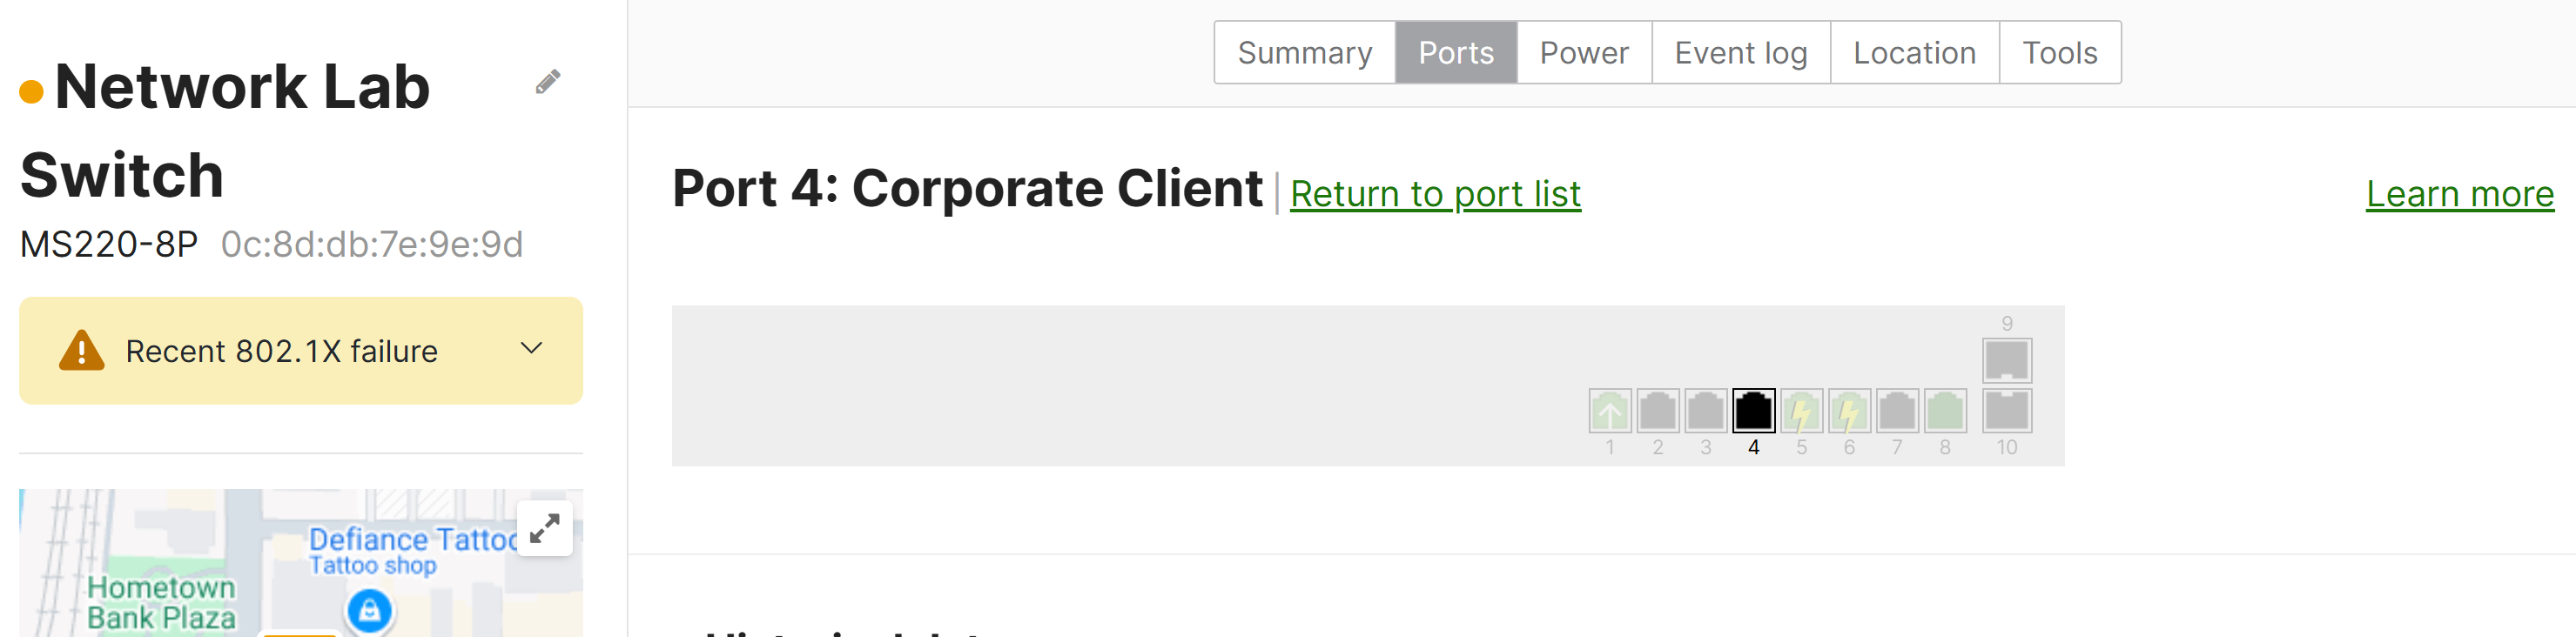
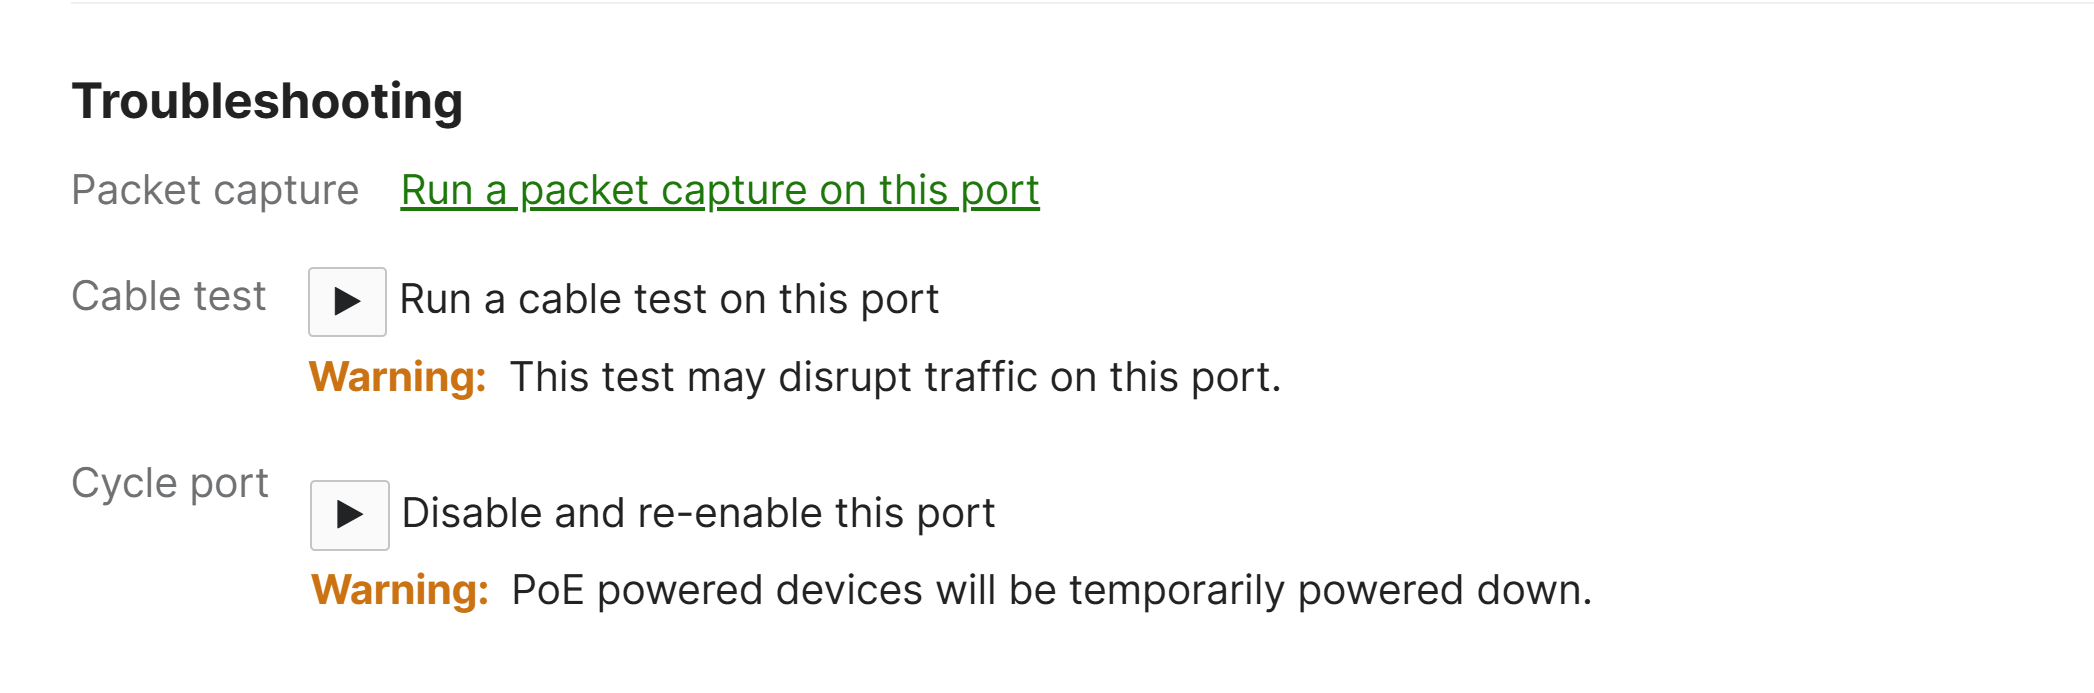
Switch Packet Capture - Method 2: Port Troubleshooting Section
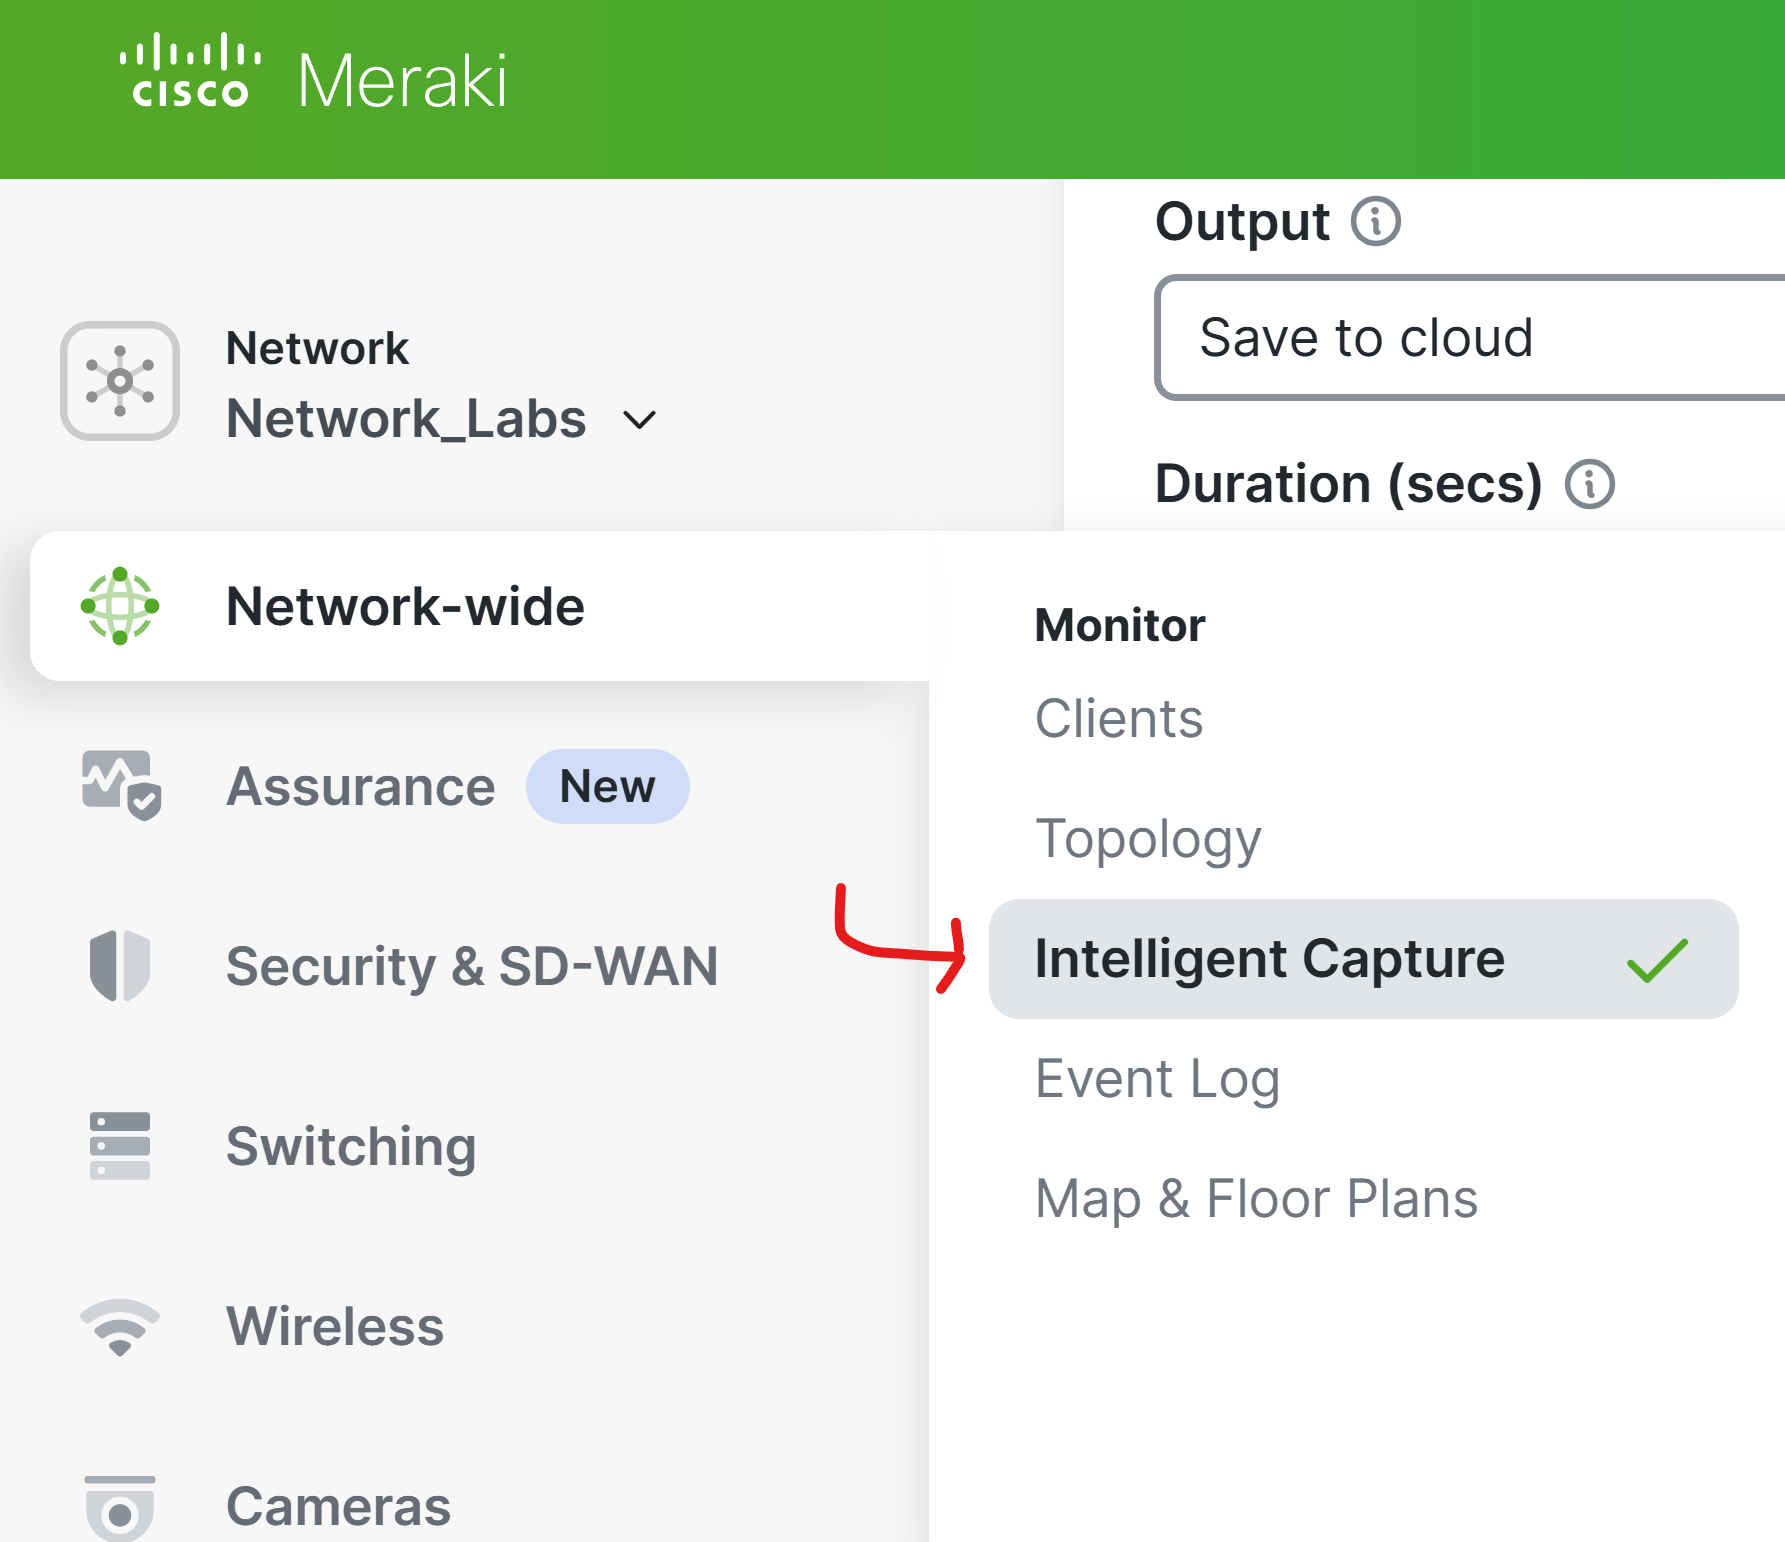
MR Intelligent Packet Captures
- Per Cisco, Intelligent Captures is a new feature dedicated to MR access points, automating the packet capture process. Intelligent captures allows admins to initiate and retrieve packet captures on demand remotely. There are three main methods for Intelligent capture for access points: Manual Captures, Proactive PCAP, and Viewing Stored Captures
- With the Intelligence Capture page, this feature adds the ability to save packet capture files to the Cloud for 90 days with no additional cost to Meraki users
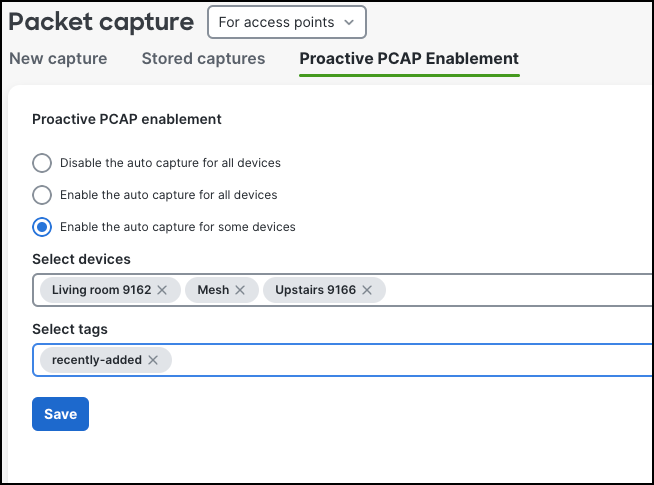
MR Intelligent Packet Captures - Proactive PCAP
- Per Cisco, this Packet Capture feature automatically generates captures in the event of either a client connection failure or a roaming issue. Meraki users can access Proactive PCAP files whenever they are needed. Automated packet captures are limited to client association/authentication failures
- This feature can be enabled on a per access point basis, by tag, or by all devices
- To use this advanced feature, the MR-ADV (Advanced) license is required in addition to MR 31.1.3 or above firmware using Wi-Fi 6/6e or a newer model
- Packet Captures are retained for 7 days and are automatically purged to make room for new captures after those 7 days
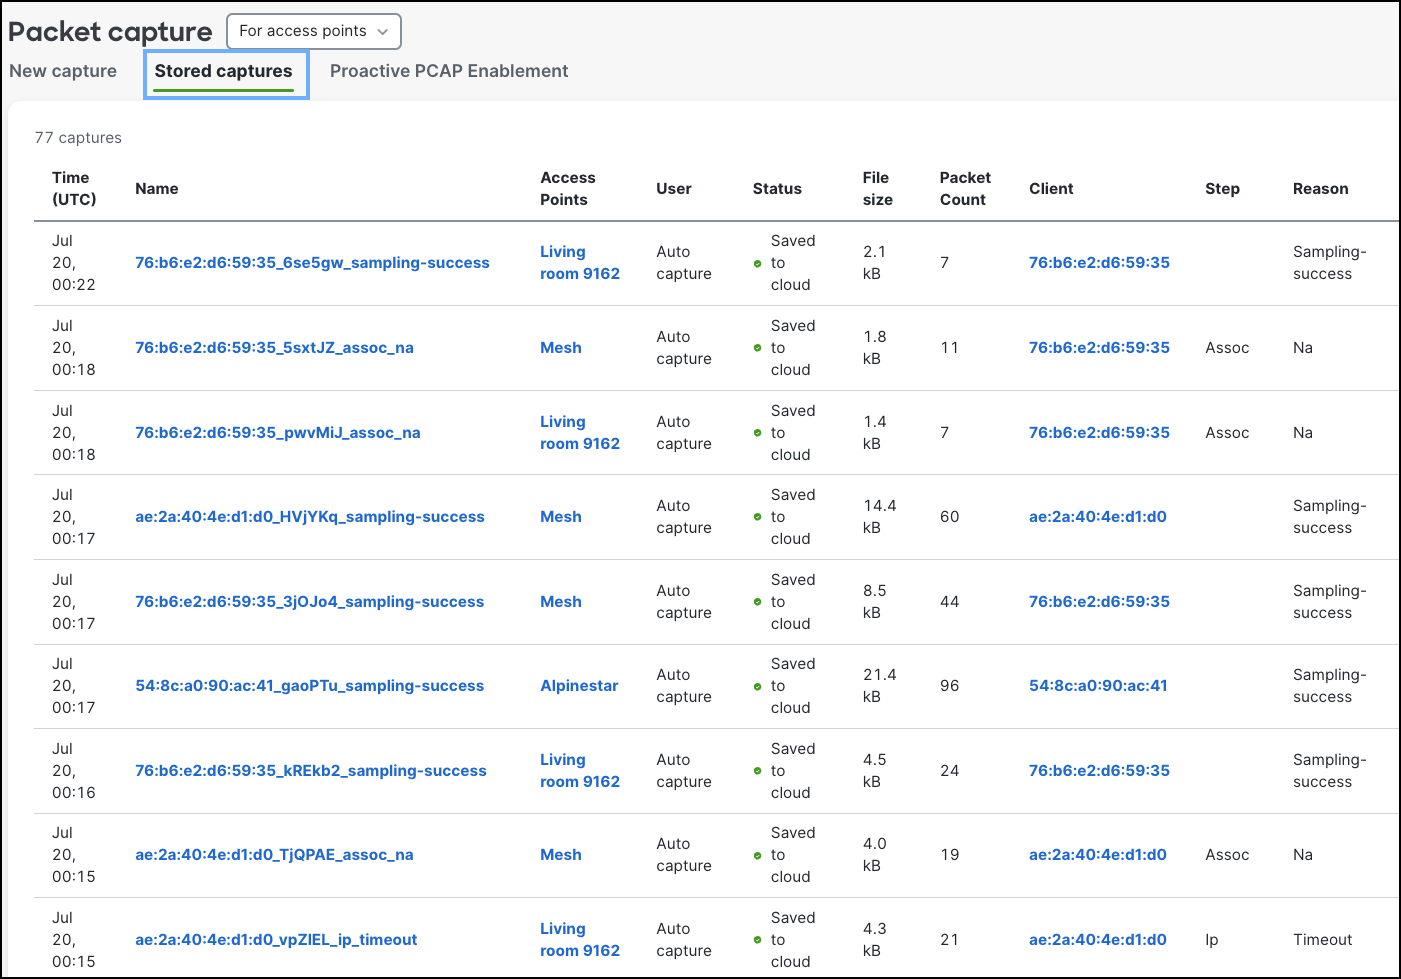
MR Intelligent Packet Captures - Stored Captures
- Per Cisco, this feature stores all packet captures, including both manual captures and Proactive PCAPs with details such as timestamps, and failure reasons that triggered a Proactive PCAP
- Meraki users can view and download any packet capture from the list
- Per Cisco, Automatic packet captures taken using the Proactive PCAP feature can be accessed from the Stored Capture tab on the Clients page via the Meraki Dashboard
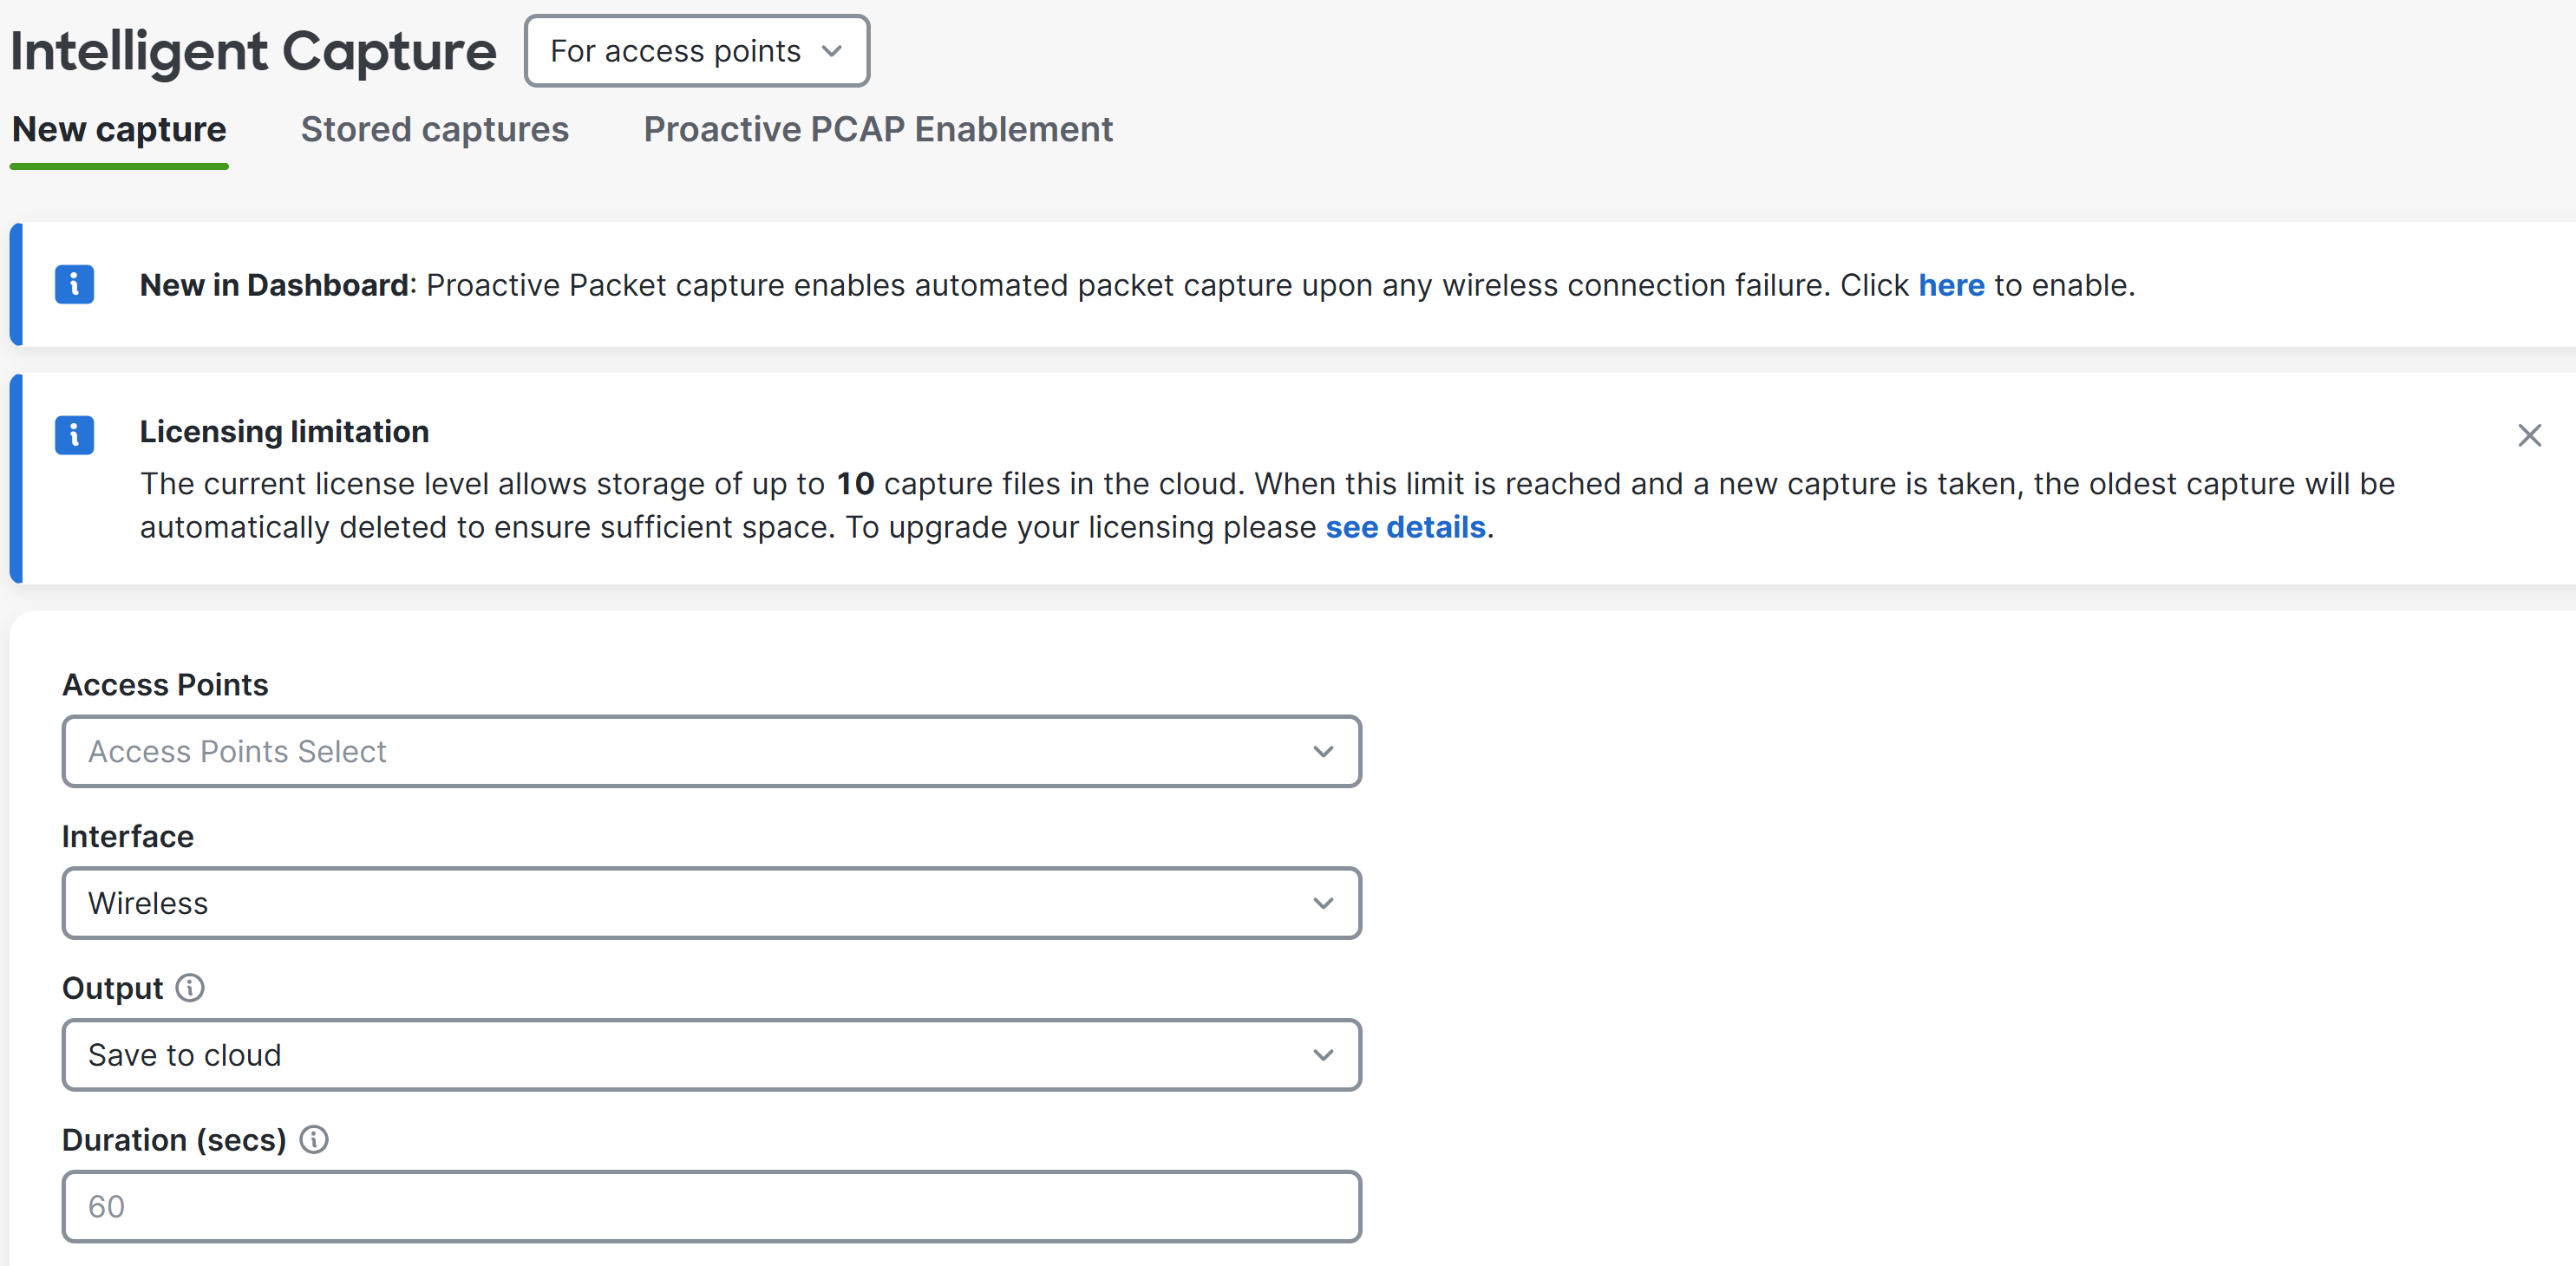
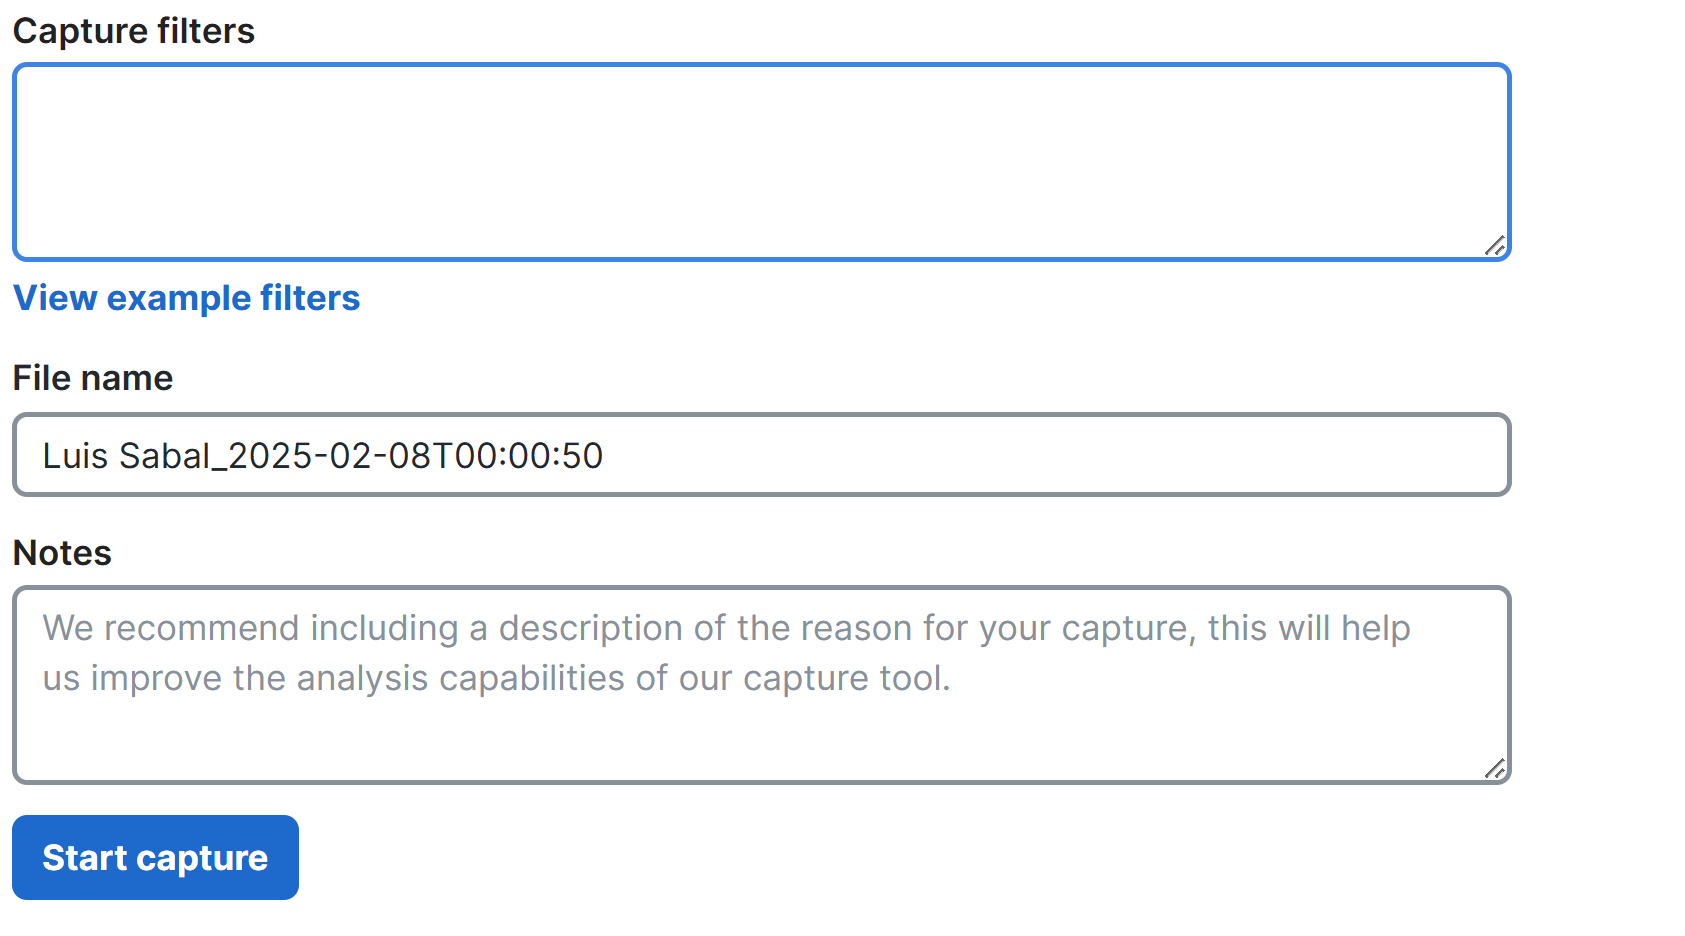
MR Manual Capture Options
- Access Point
- Select the access point to run the capture on
- Interface
- Select the capture method; Wired - captures traffic that is sent to the switch; Wireless - captures traffic that is sent on the wireless radio
- Per Cisco, it is recommended to capture only on the wired interface
- Output
- Select how the capture should be displayed; view output below or download .pcap
- Duration
- Define the duration of the Packet Capture
- Capture Filters
- Apply a capture filter
- File Name
- Apply a packet capture filename
- Notes
- Apply a capture note
MR Intelligent Packet Capture Menu
MR Intelligent Packet Capture - Manual Captures
MR Intelligent Packet Capture - Proactive PCAP (Meraki Example)
MR Intelligent Packet Capture - Stored Captures (Meraki Example)
MX Packet Captures
- Per Cisco, WAN appliances cannot capture traffic that they switch between LAN clients; only routed traffic, or broadcast and multicast traffic that is flooded on the LAN will be visible
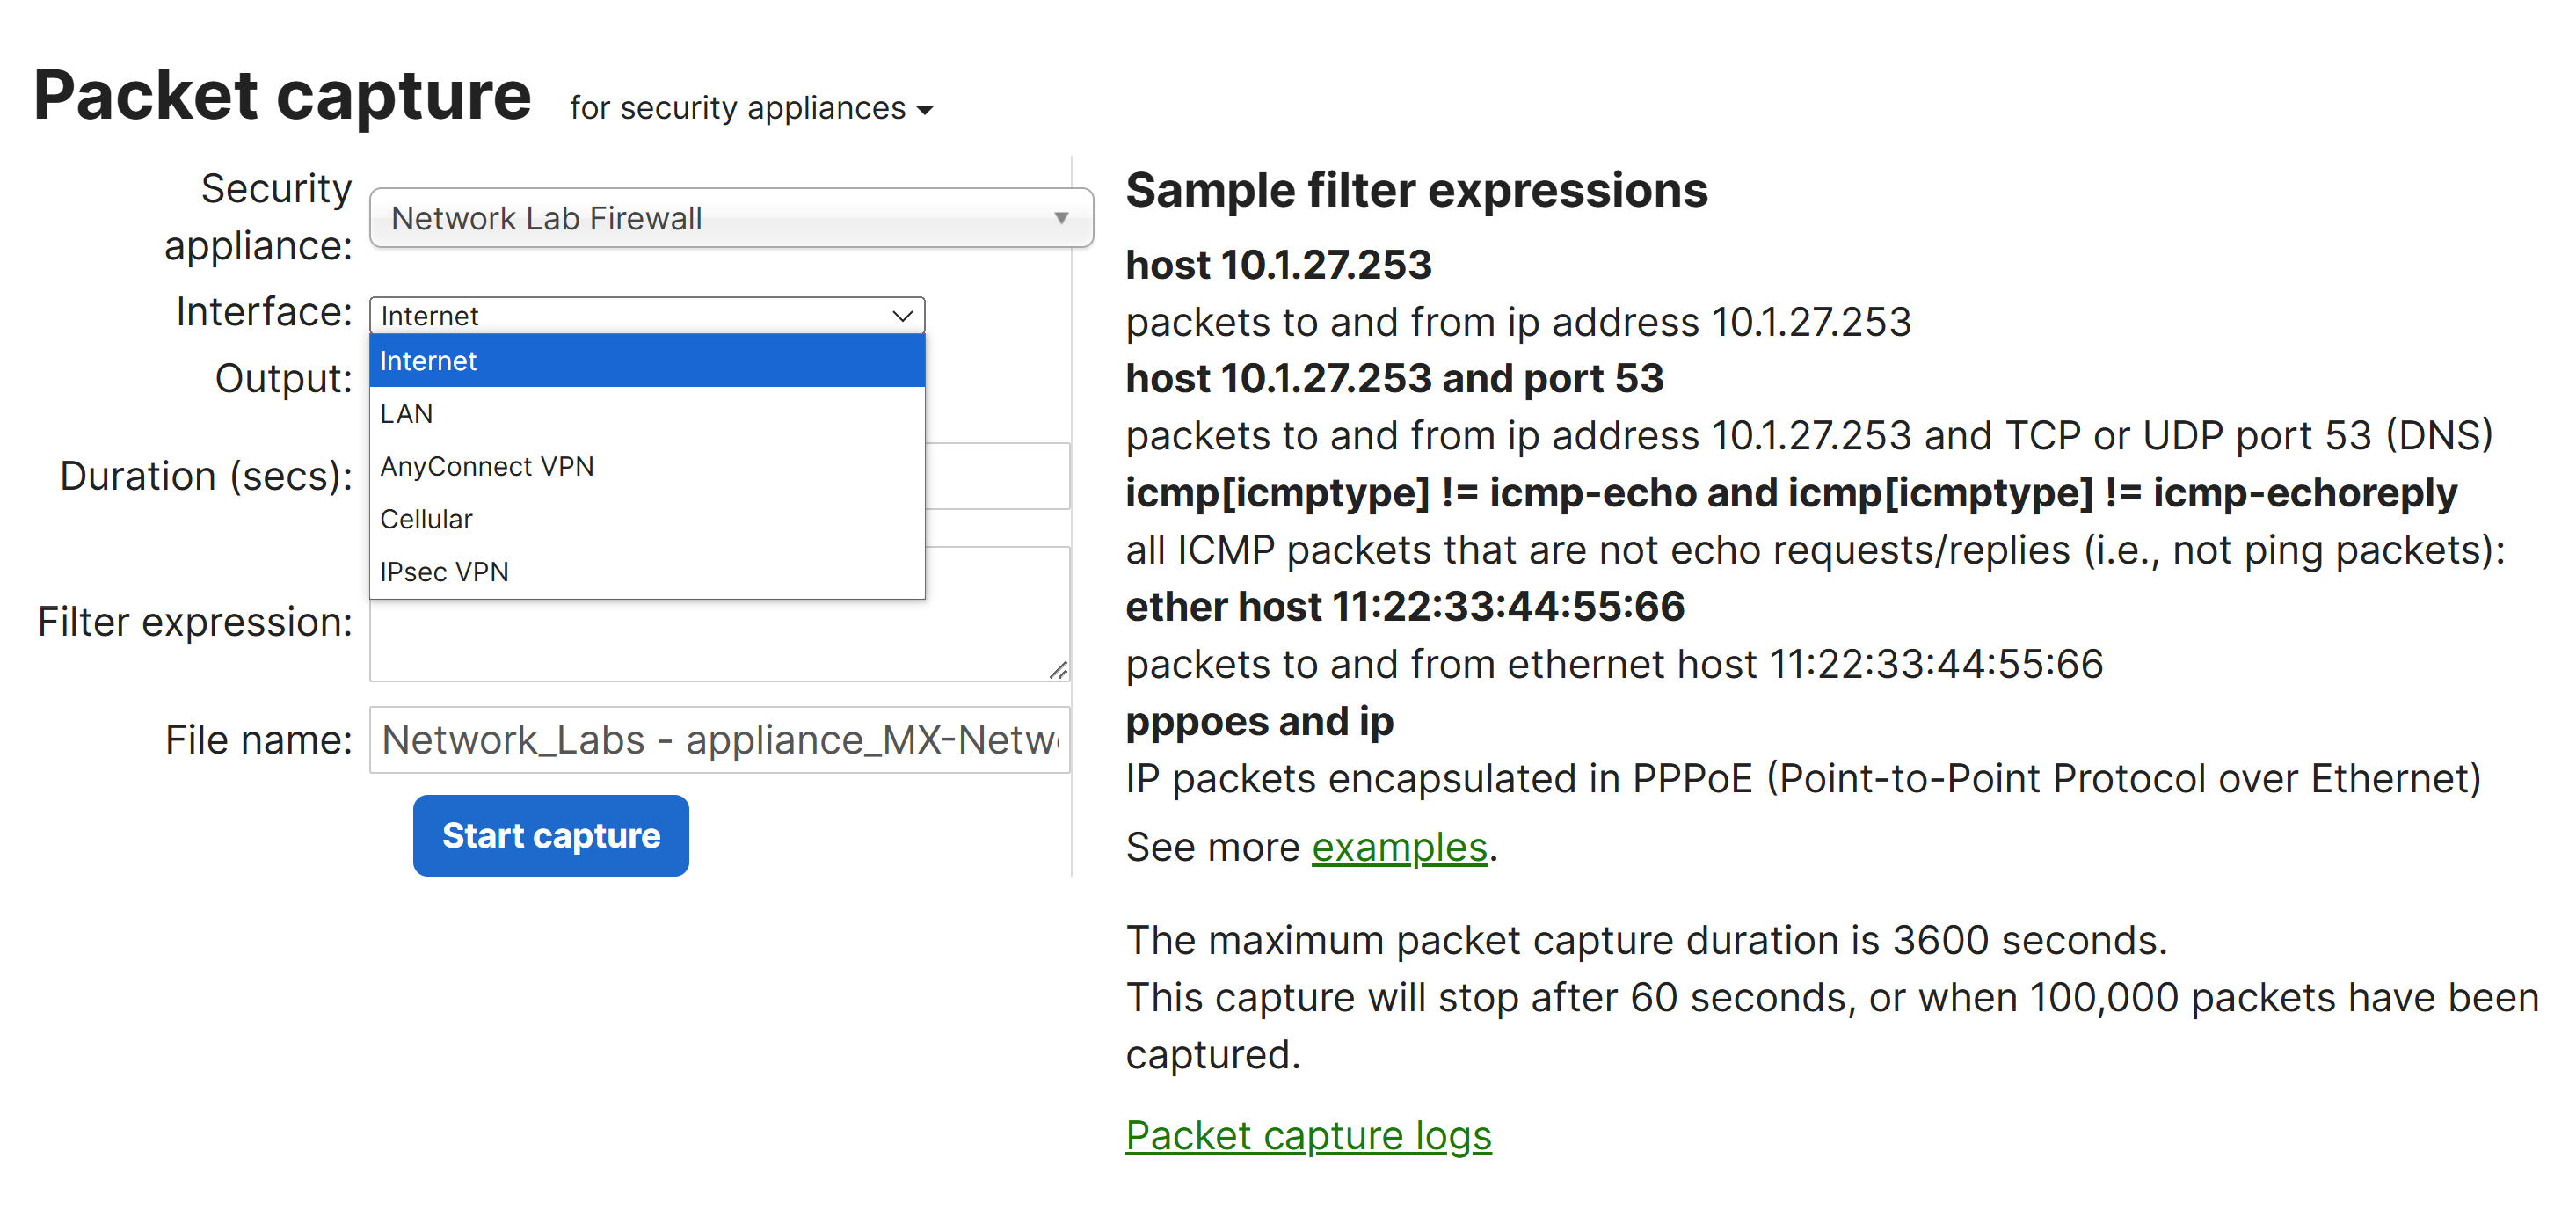
MX Options
- Security Appliance
- Select the security appliance to run the capture on
- Interface
- Select the interface to run the capture on
- Per Cisco, some interfaces will only show if the corresponding feature is enabled (ClientVPN, Site-to-Site VPN)
- Interface examples vary depending on WAN appliance configuration:
- Internet 1/2: traffic on WAN link(s)
- LAN: traffic from LAN ports
- Cellular: cellular traffic
- Site-to-Site VPN: AutoVPN Meraki traffic
- IPsec VPN: Non-Meraki VPN traffic
- Output
- Select how the capture should be displayed; view output below or download .pcap
- Verbosity
- Select the level of the packet capture (when using Output, 'view output below')
- Duration
- Define the duration of the Packet Capture
- Filter Expression
- Apply a capture filter
- File Name
- Apply a packet capture filename
MX Packet Capture Overview
Packet Capture Filters
- Per Cisco, Capture Filters are what the Meraki Dashboard is going to use to search for packets to download during the scan. Generally, it is recommended that captures on the LAN side of the MX appliance should use the computer's IP address (capture traffic of data to and from the computer). Captures on the Internet interface should use the destination public IP address as clients are going to be NATed to the IP of the MX's uplink
Filter Examples
- host 10.92.182.6
- capture all data to & from the computer
- host 8.8.8.8
- capture traffic going to Google DNS server
- ether host 00:18:0a:aa:bb:cc
- only capture for a specific MAC & will not work on interfaces where traffic has been NATed
Wireshark Display Filters
- Wireshark display filters are used to selectively view and analyze network traffic that meets specific criteria
- These filters allow you to focus on particular packets or conversations within the packet capture, making it easier to troubleshoot and analyze network issues, monitor traffic, and detect anomalies
- Display filters are applied after the packets are captured, allowing admins to refine the data shown on Wireshark's interface
- Unlike capture filters (which limit the data captured by Wireshark), display filters only affect what is shown in the Wireshark window during analysis
Common Protocol Filter Examples
- tcp
- Will only display TCP packets
- Example: 'tcp.port == 80' - will only show HTTP web traffic
- Example: 'tcp.port == 443' - will only show HTTPs web traffic
- udp
- Will only display UDP packets
- Example: 'udp.port == 53' - will only show DNS traffic
- icmp
- Will only display ICMP (ping) packets
- dhcp
- Will only display DHCP packets
- dns
- Will only display DNS packets
Device Filter Examples
- ip.addr == 10.92.182.6
- Will display frames that have 10.92.182.6 in either the source or destination field
- eth.addr == 00:18:0a:aa:bb:cc
- Will display frames that have 00:18:0a:aa:bb:cc in the source or destination field
Logical Operators
- ip.addr == 10.92.182.6 and dns
- Will only show the host 10.92.182.6 and its DNS traffic
- The 'and' operator combines two or more filters together and will only display results if all statements are true
- ip.addr == 10.92.182.6 or ip.addr == 172.16.7.7
- Will display both 10.92.182.6 as well as 172.16.7.7
- The 'or' operator combines two or more filters together and will display results if either one of the statements are true
- not ip.addr == 172.16.7.7
- Is going to exclude all traffic that has an IP of 172.16.7.7
- The 'not' operator will exclude specific elements from the filter
- (ip.addr == 172.16.7.42 or ip.addr == 172.16.7.7) and dns
- Is going to show dns traffic for two IPs 172.16.7.42 and 172.16.7.7
- The '()' operator can combine elements together where the order of operations matter and allows for both 'and' & 'or' logical operators
- (ip.addr == 172.16.7.42 and dns) or (172.16.7.7 and icmp)
- Is going to show DNS traffic for 172.16.7.42 as well as icmp traffic for 172.16.7.7
Tips & Tricks
- Troubleshooting DHCP
- dhcp.hw.mac_addr == a4:83:e7:c9:37:cd
- Cisco recommends using the following filter because of the way that DHCP works a lot of the time, you will not see all traffic if you just search for the mac address and dhcp. With this method, you can see all of the attempts for a client to get an IP
- Right Click & Apply as Filter
- Per Cisco, in the packet details, if you find something that you want to filter for, you can right-click and select 'Apply as Filter > Selected'
- Transaction IDs are also a good filter to identify a particular exchange
- Follow TCP Stream
- Right clicking on a packet will allow you to Follow the TCP Stream and will only show the particular TCP connection
- The 'not' operator will exclude specific elements from the filter
- DNS Troubleshooting
- !dns.response_in and dns.flags.response == 0 and dns
- Per Cisco, if you're looking for DNS queries that are not getting responded to, you might try the following advanced filter. This filter uses the lack of a recorded reply (!dns.response_in) combined with only looking for DNS queries (dns.flags.response == 0) that are only UDP port 53 for DNS